Monitoring and Management
Like all Celery applications, GWCelery supports a rich selection of management and monitoring tools. Here is an introduction to a few of them.
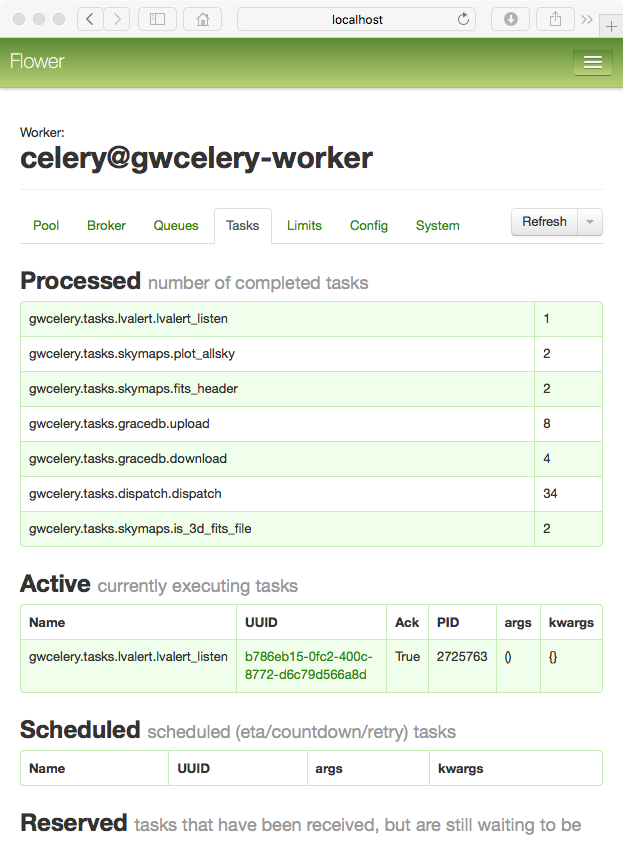
Flower
Flower is a dashboard for monitoring Celery tasks. To start Flower for monitoring during local development, run the following command and then navigate to http://localhost:5555/ in your browser:
$ gwcelery flower
To set up monitoring on a LIGO Data Grid cluster machine (e.g.
emfollow.ligo.caltech.edu) protected by LIGO.org authentication, start
Flower using the following command:
$ gwcelery flower --url-prefix=~${USER}/gwcelery
add the following lines to the file ~/public_html/.htaccess:
RewriteEngine on
RewriteRule ^gwcelery/?(.*)$ http://emfollow.ligo.caltech.edu:5555/$1 [P]
Some additional firewall configuration may be required.
Command-Line Tools
All Celery application provide command-line monitoring and management utilities, including the following:
gwcelery shell: Start an interactive Python or IPython interpreter for interacting with Celery. All tasks as well as theappapplication instance are automatically imported and available as globals. Example:$ gwcelery shell Python 3.6.6 (default, Jun 28 2018, 05:43:53) Type 'copyright', 'credits' or 'license' for more information IPython 6.5.0 -- An enhanced Interactive Python. Type '?' for help. In [1]: download.s('coinc.xml', 'M6757').delay().get()gwcelery call: Call a task from the command line by passing it arguments in JSON format. The output is the unique identifier of the result. Example:$ gwcelery call gwcelery.tasks.gracedb.download --args='["coinc.xml", "M6757"]' d11099e7-75e5-4aa3-800b-b122b667757c
gwcelery result: Get the result of a previously called task. Example:$ gwcelery result ab4aa6d7-9f21-420c-8401-cbe6863cf7dc (b'<?xml version=\'1.0\' encoding=\'utf-8\'?>\n<!DOCTYPE LIGO_LW SYSTEM "htt' b'p://ldas-sw.ligo.caltech.edu/doc/ligolwAPI/html/ligolw_dtd.txt">\n<LIGO_L' ... b'\t</Stream>\n\t</Table>\n</LIGO_LW>\n')
Nagios
This tool is specific to GWCelery.
The dashboard.ligo.org and monitor.ligo.org services use Nagios to monitor and report on the health of all of the components of the low-latency analysis infrastructure.
GWCelery provides the command gwcelery nagios to check the status of the
application and provide a report in the format that Nagios expects.
You can run it manually from the command line:
$ gwcelery nagios
OK: GWCelery is running normally
To configure Nagios itself, see the Nagios configuration overview, or if GWCelery and Nagios are running on different hosts, the Nagios Remote Plugin Executor (NRPE) documentation